Why Every SaaS Product Will Need an Analyst Agent
The next evolution in business analytics moving beyond dashboards to automated interpretation. Why Analyst Agents are becoming essential infrastructure for every SaaS product.
Why Every SaaS Product Will Need an Analyst Agent
Most SaaS products today are incredibly instrumented. There are databases capturing every event, dashboards refreshing every few minutes, alerts firing on thresholds, and AI copilots ready to answer questions. Teams have more data than ever. And yet, Monday morning still begins the same way it did ten years ago: someone pulls up a spreadsheet, starts comparing numbers, and spends three hours figuring out why last week looked different from the week before.
The problem was never data access. It was always interpretation.
The Dashboard Is Passive by Design
A dashboard is a display. It shows you what happened. It does not tell you why it happened, whether it matters, or what you should do next. That last mile, the part between "a number changed" and "here is what it means," is still almost entirely manual.
Think about what that actually looks like in practice. A metric drops. Someone notices. They open a second dashboard, then a third. They filter by segment, by region, by cohort. They check whether the drop is isolated or widespread. They write a Slack message summarizing what they found. They repeat this every week, sometimes every day, for every metric they own.
This is not analysis. It is investigative labor that produces insight as a side effect. It is expensive, it does not compound, and it is almost impossible to scale without hiring more people to do the same thing.
The repetitive part of analytical work is not a small fraction of the job. For most teams, it is most of the job.
The Evolution of Analytics
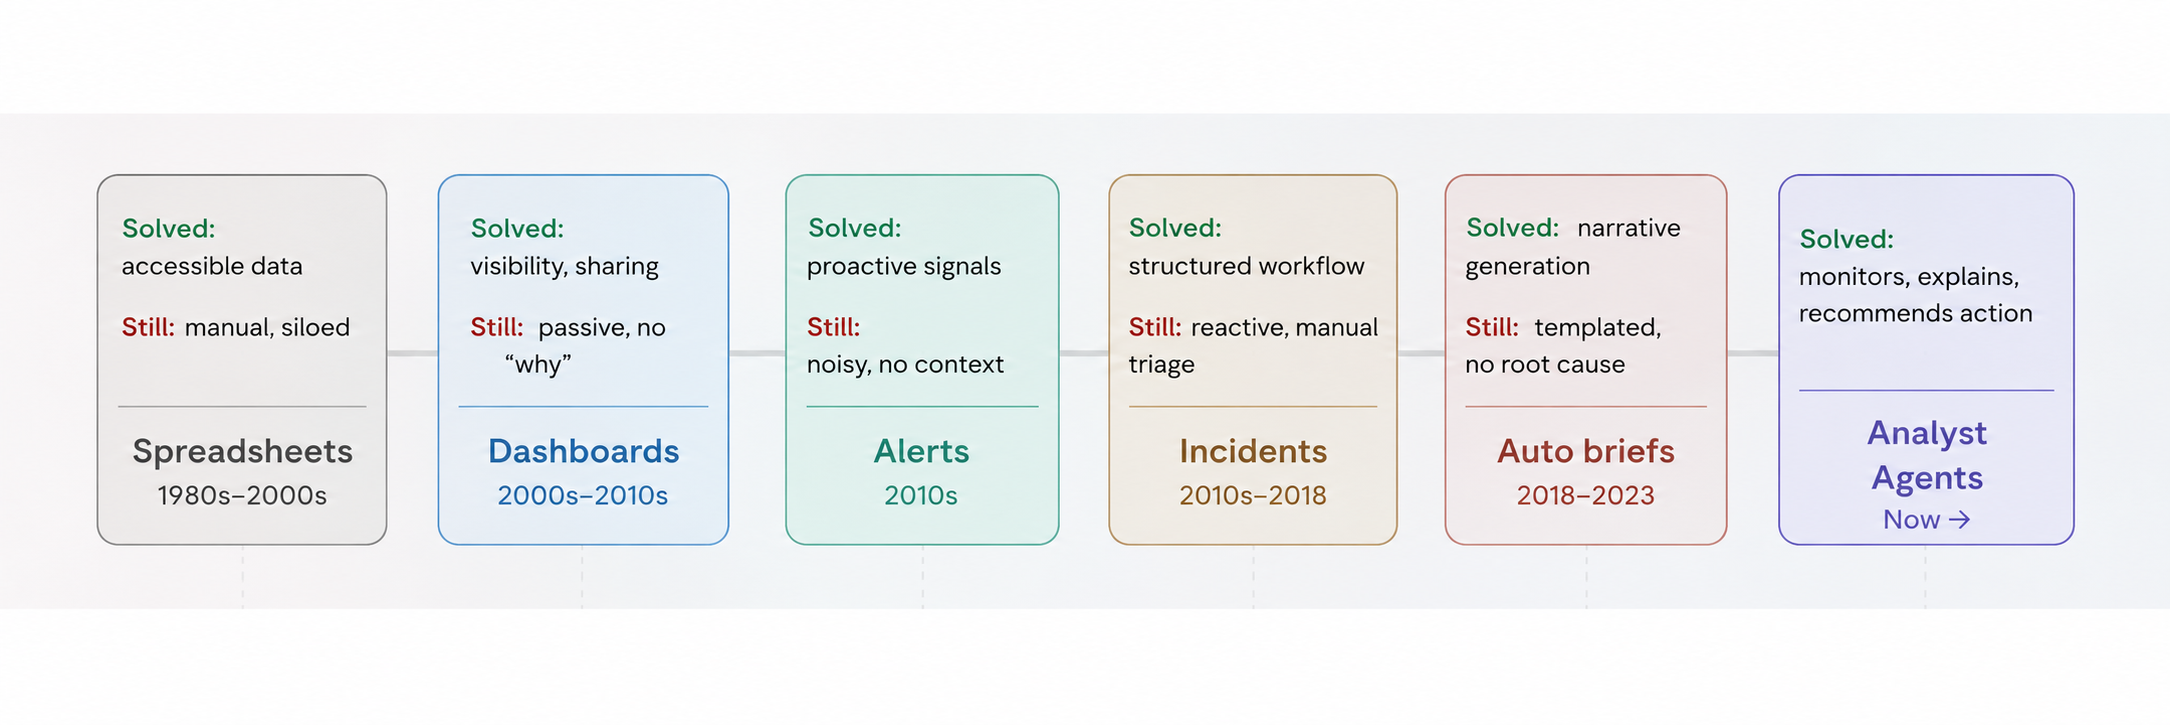
The history of business analytics is a history of reducing friction between data and understanding, with each generation solving one problem and exposing the next.
Spreadsheets made data manipulable. For the first time, you could sort, filter, and calculate without writing code. The limitation: everything was manual, static, and lived on someone's laptop.
Dashboards made data visible and shared. Metrics became organizational artifacts rather than individual ones. The limitation: dashboards answered "what" but not "why," and they required someone to go look.
Alerts made anomalies proactive. Instead of checking dashboards, you got notified when something crossed a threshold. The limitation: alerts generated noise. They told you something happened, but not what it meant.
Incident systems gave structure to anomalies. When something went wrong, there was a workflow for investigating, assigning, and resolving it. The limitation: incidents were reactive, manual, and siloed from broader business context.
Automated briefs started generating narrative from data on a schedule. Weekly summaries, automated reports, generated commentary on key metrics. The limitation: they were templated and context-free. They could tell you revenue was down 12%, but not why.
Analyst Agents are the next step. They close the gap between notification and explanation.
What an Analyst Agent Actually Is
An Analyst Agent is not a chatbot with access to your database. It is not a smarter dashboard. It is a system that does what a good analyst does: monitors continuously, notices what matters, understands context, investigates causes, and produces explanations.
The distinction matters. A BI tool answers questions you think to ask. A chatbot answers questions you explicitly type. An Analyst Agent surfaces what you did not know to ask about, explains it with business context already applied, and suggests what to do next.
This is a different mode of intelligence entirely.
Where a dashboard says:
"Revenue is down 18%."
An Analyst Agent says:
"Revenue declined 18% week-over-week. The largest contributor was a reduction in enterprise conversions from the healthcare segment, accounting for 63% of the decline. Marketing spend remained constant, which suggests the issue is conversion-related rather than acquisition-related. Pipeline volume from that segment has not changed, so the drop likely reflects something happening during the sales cycle rather than earlier."
The difference is not aesthetics. It is time. That second response is what a good analyst produces after two hours of work. An Analyst Agent produces it in seconds, continuously, across every metric you care about.
The same pattern holds across every domain.
Product adoption: Instead of "Feature X usage dropped 22% this week," an Analyst Agent surfaces that the drop is concentrated in users who onboarded in the last 30 days, and that a UI change shipped three days before the drop correlates with an increase in drop-off at the same step in the flow.
Customer retention: Instead of "Churn increased this month," an Analyst Agent notes that churned accounts shared a specific usage pattern, specifically high initial activation followed by a drop in weekly active use around day 45, and that no automated intervention exists at that point in the lifecycle.
Operations: Instead of "Support ticket volume is up 34%," an Analyst Agent identifies that 71% of the increase comes from a single error code that appeared following last Thursday's deployment, and that resolution time for those tickets is 4x higher than baseline.
In each case, what changes is not the data. What changes is that someone did the work of turning data into an explanation, and that someone is now automated.
Why This Becomes Possible Now
Analyst Agents are not a new idea. What is new is that the underlying capabilities to build them are finally mature enough to be useful in production.
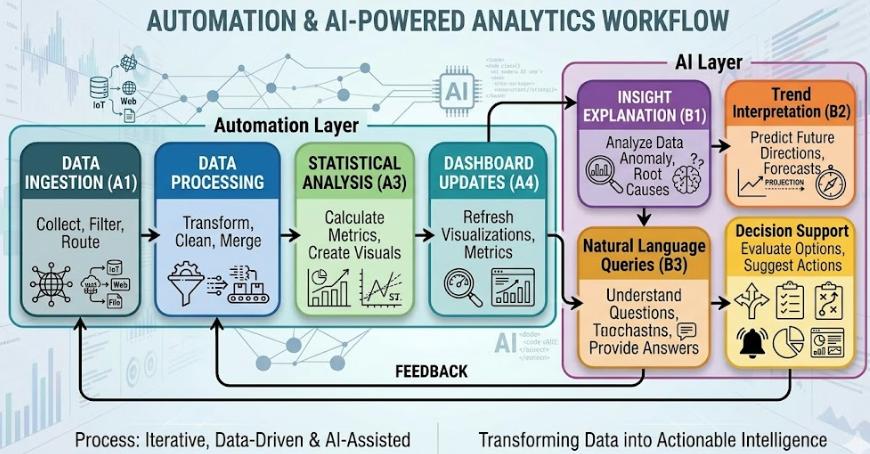
Large language models can now reason over structured business context and produce coherent, accurate narratives. Context windows have grown large enough to hold meaningful slices of business history, not just a single row. Event-driven architectures make it possible to trigger analysis in real time when something changes, rather than running batch jobs on a schedule. Retrieval and knowledge layers let agents pull in relevant historical context, segment definitions, business rules, and prior explanations without hallucinating them.
None of these capabilities existed at this level of reliability two years ago. The bottleneck was not the idea, it was the execution cost. That cost has dropped sharply.
A Personal Reflection
Working across analytics infrastructure, incident management systems, alerting workflows, and automated reporting, I kept running into the same pattern. The data was almost never the problem. The problem was that nobody agreed on what the data meant.
Teams would have access to the same dashboard and walk away with different interpretations. Alerts would fire and get ignored because the context for why they mattered was not attached to the alert itself. Reports would get generated and then someone would spend half the meeting re-explaining what the numbers said before they could get to what the numbers meant.
I noticed that alerting is easy. Generating trust in an alert is hard. The moment you fire something that does not matter, you train people to ignore everything that comes after. The hardest part of building analytics systems is not the pipeline or the visualization. It is noise reduction and explanation. It is making sure that when something surfaces, people believe it and know what to do with it.
Decision-makers, almost universally, want explanations rather than dashboards. They do not want more charts. They want someone to tell them what is going on and why. Most data problems are actually context problems in disguise.
That observation is what made me think the next major layer in analytics would not be another BI tool. It would be something that does what the most useful analyst in the room does: notices what matters, explains it clearly, and tells you what to look at next.
What the Next Five Years Look Like
Several shifts feel nearly inevitable.
Every SaaS product will have an analyst layer. This will become a table-stakes feature, the same way dashboards became expected in the last decade. Products that cannot explain their own data will feel incomplete.
Stakeholders will consume fewer dashboards and more generated narratives. The weekly business review will be accompanied by a generated summary that already explains what happened and why, and the meeting will shift from reporting to deciding.
Alerts will evolve into explanations. Raw threshold notifications will increasingly be replaced by contextualized explanations that include probable cause and suggested next action.
AI systems will participate in business reviews. Not as novelty, but as a functional layer that has already done the investigative work before the meeting starts.
Analyst workflows will become partially autonomous. Routine investigation, the kind that follows the same logic every time, will be handled by agents. Human analysts will focus on judgment, strategy, and the questions that require genuine creativity.
The Part Worth Saying Clearly
Dashboards are not going away. Analysts are not going away. The judgment required to navigate ambiguity, to ask the right questions, to understand organizational context that no system has been trained on, that remains distinctly human work.
What is going away is the part of the job that is just labor. The checking. The filtering. The writing of the same summary in a slightly different format for the fifth week in a row.
That work will be automated. Not because AI is magic, but because it is a pattern-recognition and narrative-generation problem, and those are now solvable.
The next major interface for business intelligence may not be a dashboard. It may be an agent that already knows what happened, already knows why, and is waiting to tell you what to do about it.